|
As I have been both a design teacher and a school librarian, this Oxfam resource sings to my heart! Planning Research for Influencing Diagram is not necessarily designed for school students, but can be super useful! This shifts the idea of researching as a way of simply gathering facts and anaysing their validity, to actually analysing their usefulness, and then using them! It also helps students see that different types of information and useful for different purposes and audiences. As a design teacher I had this resource laminated in my classroom, (along with a few other helpful resources that students could take to their desks while working). This was used when creating a research plan, when delivering their design brief, and even in the analysis of their product, (too often this is a personal analysis, but I would often ask them to write their analysis as if they were delivering it to their client!). In design students are often creating for a user and client. Sometimes these are the same people, but often they are not. For example: designing affordable food, with a low carbon footprint for a school canteen. Here the students and teachers are the users, but the school is the client. The information you provide the teachers and students could include 'human face to the story', 'killer facts-easy to remember', 'clear impact...' but the school might also want to know about things like cost. This resource can be used for any project where their is an audience (for example, any assessment created with GRASPS). It can also be used outside of the classroom - for example, if you want to start a new iniative or create change in your school, students would present the information to their peers, students of different ages, parents, teachers and leadership in very different ways! I also wonder if educators can use it when sharing factual information - this makes me think of the start of year presentations all about student exam results... perhaps an infographic in the school newsletter, facts and figures for the board, but individual student success stories in the faculty meeting. I didn't use this for service learning, but on reflection, this would also be a great tool for students sharing the impact of their projects! 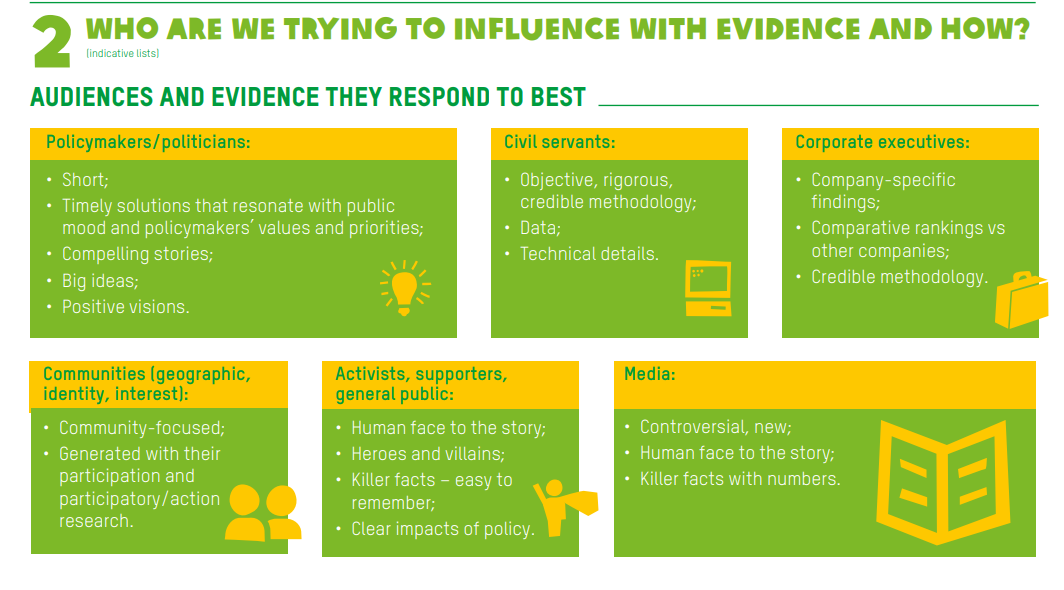 This is the part of the graphic I find most useful! I wonder if it would be worth making a graphic for design students, where they consider the different types of information they would make for different types of users and clients? or perhaps a graphic for influencing change in schools, where it says the different types of information for parents, students, teachers, the board, etc? What are you go-to resources you use over and over? What are the resources not made for educational purposes, that you have hijacked? Let me know - I am always looking for things to add to my toolkit!
If this was helpful, consider buying me a coffee. Comments are closed.
|
Archives
June 2023
|
 RSS Feed